We started working on this account mid-April.
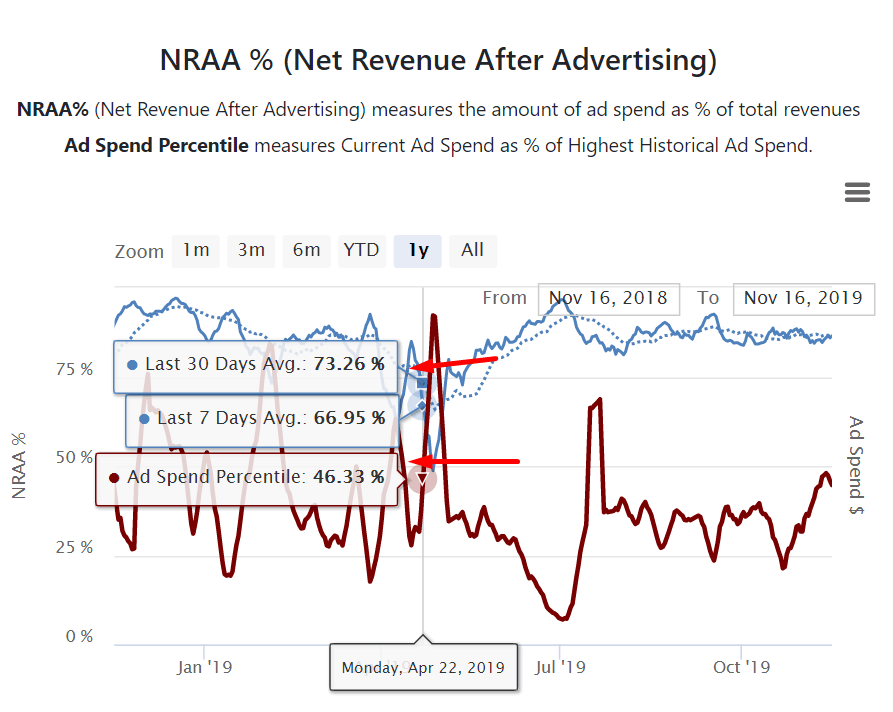
You can see their ad spend percentile was at 46.33%. Net revenue after ad spend (NRAA) is at a 73.26% 30-day average. What this means is that ad spend is very high and NRAA is low, which indicates that even though ad spend is high, it is not yielding desired results.
NRAA1
NRAA2
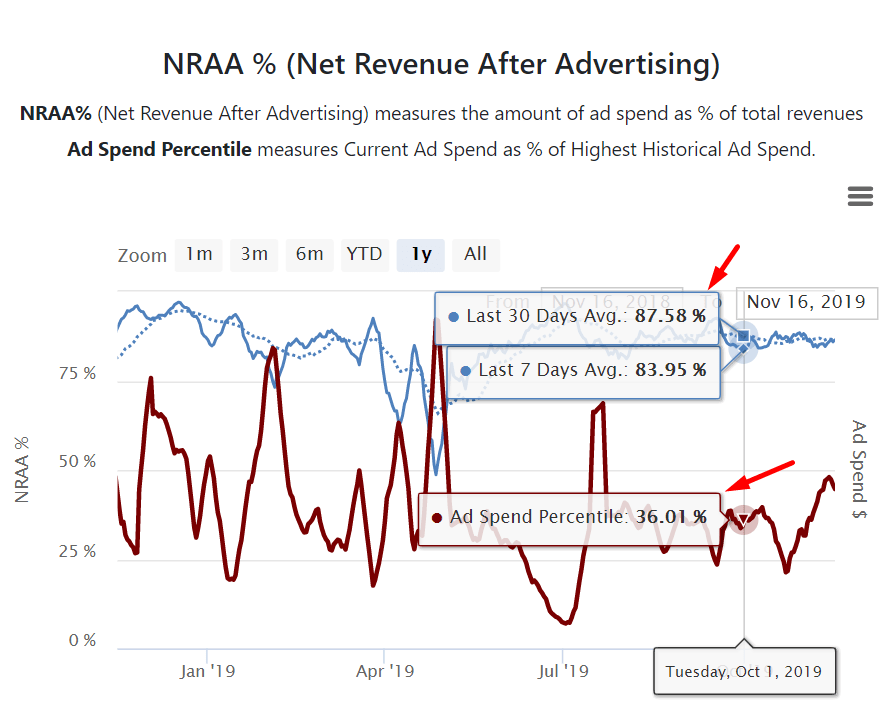
In this image, you can see a snapshot of the account on Oct 1st, less than half a year after. Ad spend percentile is at 36.01% and NRAA is at 87.58%. This indicates that ad spend is much lower, but every dollar spent is yielding much better results.
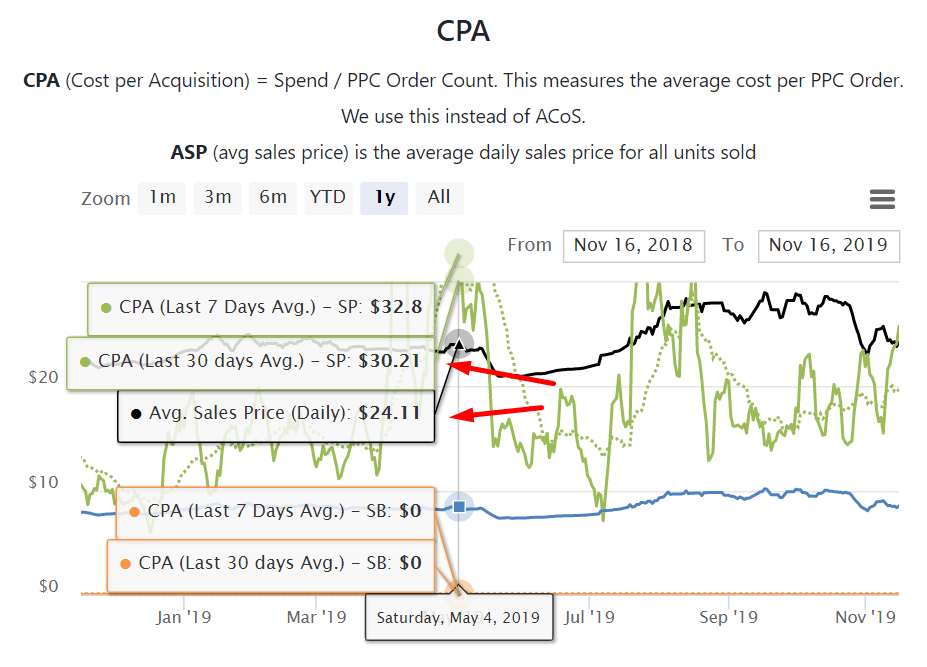
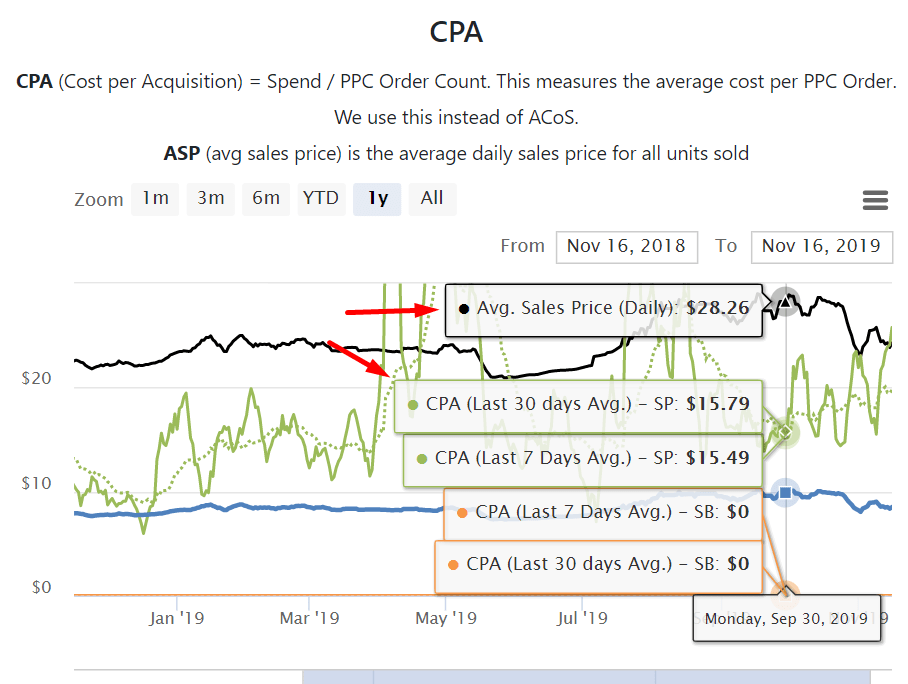
Another way of showing that ad spend was optimized into yielding better results can be shown based on CPA (cost per acquisition) metrics – In this image you can see that at the beginning of May 30-day average CPA was at 30.21$. On September 30th, 30-day average CPA is at 15.79$.
Ppc cpa 1
Ppc cpa 2
Spend 1
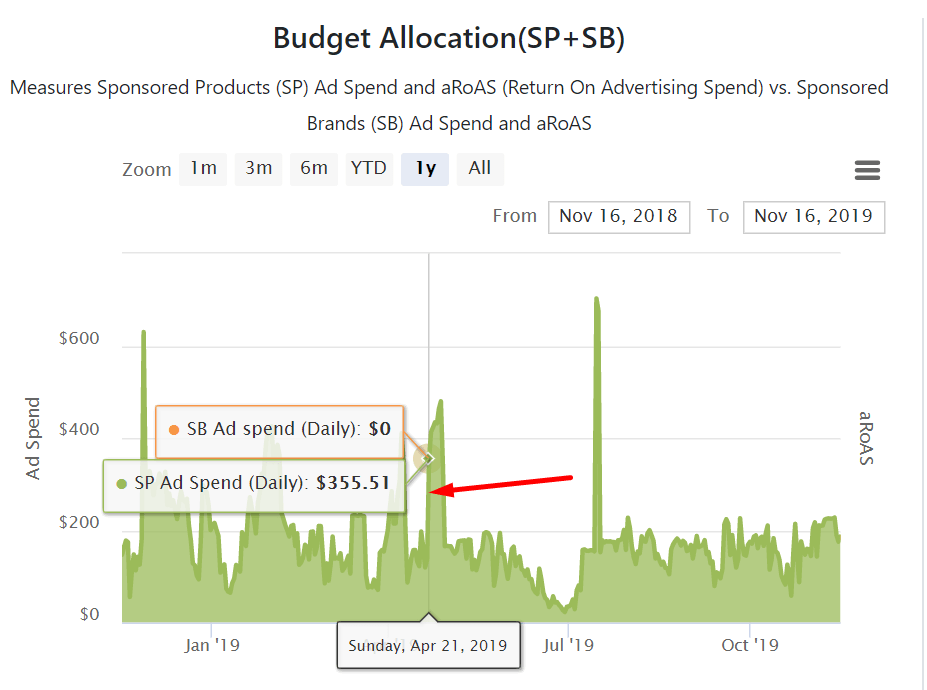
Spend 2
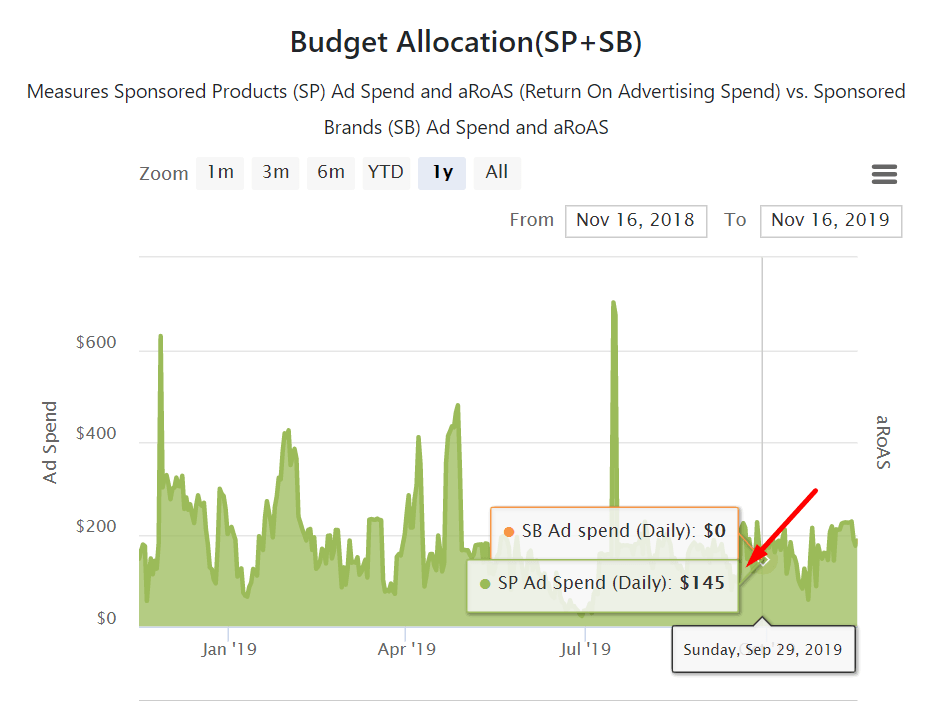
Here we can see in Dollar amount the difference in average daily spend between the end of April at 355.51$ and 145$ at the end of September. This proves that every dollar spent on PPC at the end of April yielded fewer sales and profit, while a smaller dollar amount spent on PPC by the end of September yielded better results – Optimized campaigns!
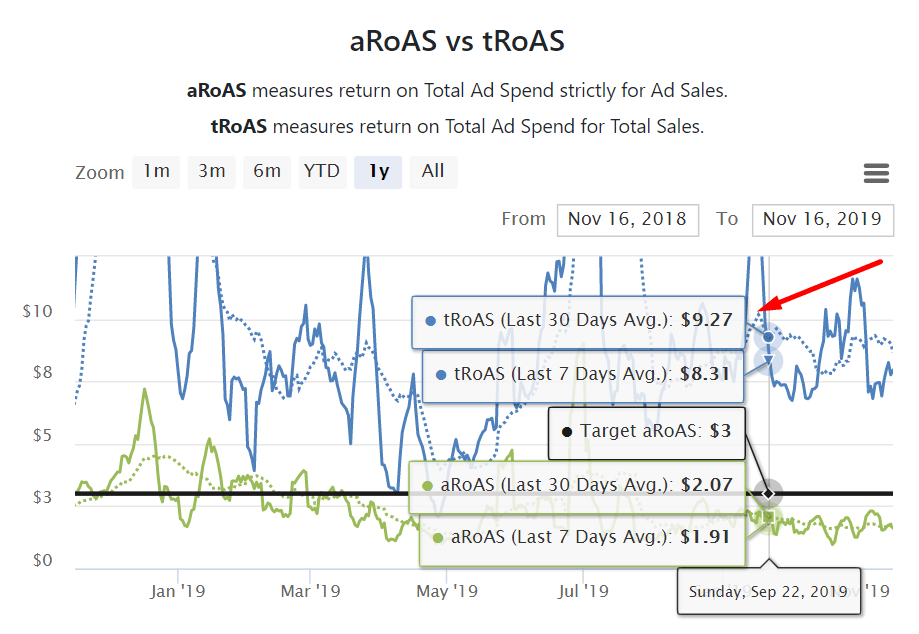
To prove the above point even more, we can look at a KPI’s called tRoAs and aRoAs. aRoAs measures return on ad spend compared only to PPC generated sales. Before we got to work at the end of April, 30-day average aRoAs was 1.53$. What this means is that for every dollar spent on PPC 1.53$ was made. By the end of September, every dollar spent on PPC generated 2.01$.
Troas 1
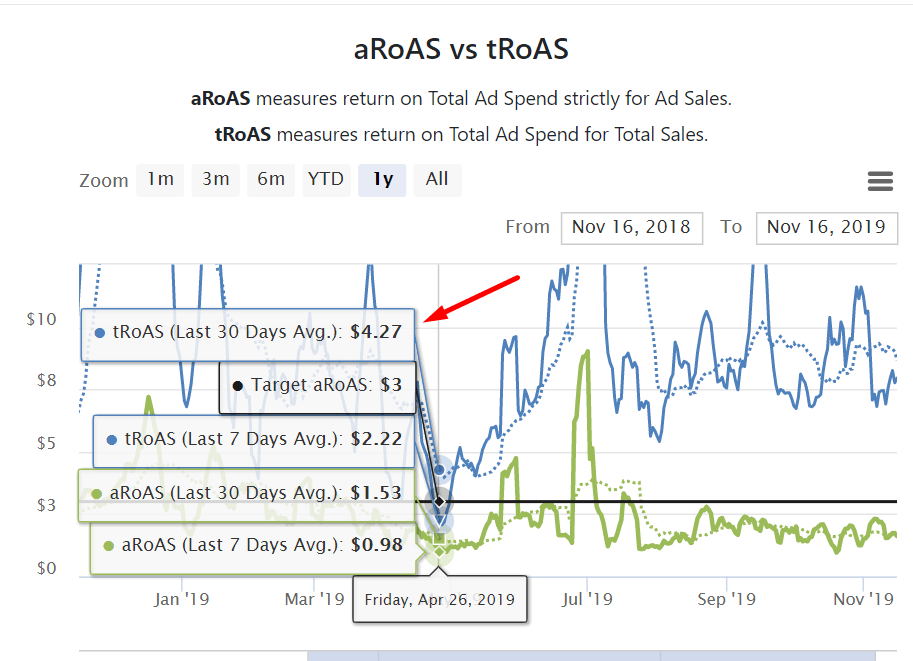
Troas 2